Wednesday, 27 March 2013
Lesson 4; We learn and Grow in the Markets
1:Learning the dynamics of goal achievement so you stay positively focused on what you want- not what you fear
2: learning how to recognise the skills you need to progress as a trader and then stay focused on the development of those skills instead of the money which is merely a by-product of your skills
3: learning how to adapt yourself to respond to fundamental changes in the markets conditions more readily.
4: identifying the amount of risk you are comfortable with your "risk comfort "levels And then learn how to expand it in a way that is consistent with you ability to maintain. An objective perspective of market activity.
5: Learning how to execute your trades immediately upon your perception of an opportunity.
6; learning how to let the market tell you how much is enough.
7: learning how to structure your beliefs to control your perception of market movement
8: learning how to achieve and maintain a state of objectively
9: learning how to recognise " true" intuitive information and learning how to act on it consistently
10: structure and design a plan of action that you can easily understand and follow.
Tuesday, 19 March 2013
Goldman Sachs Cut Rio Tinto Price Target to Sell
Goldman
Sachs Cut Rio Tinto Price Target to Sell
In a move seen as brave in the City, Goldman Sachs have cut
their price target for miner Rio Tinto and reduced it to a sell rating. This
has caused a 140 point drop in the price or the equivalent of 4.2%. There is
now potential for both a retracement of a continuation of the fall in price.
The Cypriot government have also announced that they are
going to put a hold on the potential savings tax and are going to wait to see
what Germany and Russia have to say about the current situation. This comes
after a huge amount of money was being pulled out of the country from huge
Russian and European conglomerates.
In today’s technical analysis the German ZEW Survey has been
released and has come back better than expected at +48.5 with the Consensus at +48.0.
Also the equivalent Euro zone ZEW Survey has been released at +33.4 with the
consensus being much higher at +42.4.
Fundamental analysis is weak at the moment but the world
also watches in anticipation as renewed fears of Coal miners strikes start to
grip South Africa again. A reduction in the coal production could have a very
bad effect on electricity production.
Daily
Technical Analysis
EUR/USD (19/03/2013)
EUR/USD, we have seen a continuation of the range bound movements
prevalent over the last couple of days. Near term support on EUR/USD lies at
1.2924 and resistance lies at 1.2980 a break of which would lead to the strong
psychological level of 1.3000. We are still in a long term down trend and a
continuation of this downward move would see us breaking support and moving to
R2 at 1.2880.
GBP/USD (19/03/2013)
GBP/USD, still stuck in the range of 1.5070 as support and
1.5159 as resistance. Resistance is also the 100% on our Fibonacci retracement
so presents a very strong daily level for a potential break through trade on
the top-side. The price is likely to remain in range or slightly bullish as EUR
remains weak and people look to move their currency across to the GBP. The
Daily RSI has also broken and confirmed above the 30 level to give more weight
to our bullish outlook.
USD/JPY (19/03/13)
USD/JPY, A continuation of loose monetary policy for Japan
is pushing up towards further consistent bullish moves. This is being
heightened by consistent USD strength and a strong MACD outlook for the price.
USD/JPY near term resistance lies at 95.78,
with near term support at 95.00. The market remains very bullish even though we
have seen a short term pull-back from yearly highs.
XAU/USD (18/03/13)
Gold once again pushed up to 2 month highs at 1610 yesterday
evening, but has now found itself back in the range of 1600-1610. Because there
is little to none in terms of fundamental data out today we will have to look
for a technical break of one of these levels to find ourselves consistent
profits. A break of 1610 on the top side would open up a price target of 1620.
A break of near-term support at 1600 would lead us to a downward move, with
near-term R2 at 1597.
Written By Amar Sohal
Rio Tinto Daily and 4hrs
Economic Fact:
German + Eurozone Zew
Economic Sentiment Figures set to be released 10GMT. Big Big Figures
German Zew Survey: Actual:? Consensus 480 Previous 48.2
Eurozone Zew Survey: Actual:? Consensus 43.7 Previous 42.4
Means:
If the Zew survey Comes out worse than expected
potentially Bearish for the EUR/USD and
DAX
A measure of an indicator that measures
News Fact:
Goldman Sachs Have cut their Price Target for miner RIO Tinto
and reduced it to a see Rating
Means Shares in Rio Tinto have dropped 140 points or 4.2%
will see a retracement or will shares continue to fall?


Lesson 3: The trading experience that you need to be Aware of
Lesson 3:
The trading experience that you need to be Aware of
1:Refusing to Define a loss
2:Getting locked into opinion or belief about the Market direction. From a psychological perspective that is equivalent to trying to control the market with your expectation of what it will do.
"I'm Right the market is Wrong"
3: focusing on the Monetary value of a trade , instead of the potential for the market to move based on behaviour and structure.
4:Revenge-trading as if you were trying get back at the market for what it took away from you.
5: Not following the rules of the trading System.
6: plan in for a move, or watching one coming, but finding yourself immobilised to hit the button. There denying yourself the opportunity to profit.
7: Not establishing a consistent pattern of trading success over a period of time. Then giving the market back your profits in one or two trades starting the cycle over again.
Skills to be acquired
1:learning the dynamics of goal achievement
2 learni this to recognise the skills you need to progress as a trader then stay focused on the development o those skills instead o the money. Which is merely a by product
3:Learning have to adapt yourself to respond to fundamental changes in the Market
4:Identify your risk manangmdent the how to expand it in a way that is consistent with your ability to reach that goal objective
5:Learn how to execute a trade immediately upon your perception of an opportunity
6:Important!!! Learning how to let the market tell you how much is enough instead of assessing the potential from personal view
7:Learning how to recognise true intuitive Information and how to respond to it consistently
Monday, 18 March 2013
Economic fact
Economic fact
European indices fell sharply this morning due to a surprise bailout plan for Cyprus that includes a levy for savers to help fund a $10 billion euro bailout.
Means
Levy for savers: Cypriots with less than 100,000 euros in their accounts would pay a one time tax of 6.75%
Those with deposits over that amount over that amount would pay 9.9% in tax
News fact
Shares in Barclays have been hit hard after the deposit charge announcement in Cyprus
Means
Shares in Barclays are down 3.6% will we see a retracement today or will shares continue to tumble?
FTSE 100
EUR/USD
BARCLAYS
Friday, 15 March 2013
Timelessfx News
Ok: Reuters/ Michigan consumer sentiment comes out below expectation
Actual 71.8 consensus 78.0 previous 77.6
The question is wi the Dow + S&P finally see a correction today ?
New Samsung launches the new Galaxy S4
New features inc: eye technology plus more
So watch Apple for a response
Actual 71.8 consensus 78.0 previous 77.6
The question is wi the Dow + S&P finally see a correction today ?
New Samsung launches the new Galaxy S4
New features inc: eye technology plus more
So watch Apple for a response
Timelessfx News
European markets ended at 5 year highs yesterday LED by heavy weighs Vodafone and SAB Miller
Weak data from china may weigh on markets today. Industrial output and retail sales have dropped However inflation. Is rising
Means : Vodafone + SAB miller rallied significantly on the back of positive reports from RBS+ RBC (investment bank )capital markets
The FTSE 100 is only 1.5% away from all time highs will it be Broken this week
News Fact Negative interest Rates looking more likely We're looking @ Vodafone , SAB Miller, FTSE 100 GBPUSD
USDCAD Charts ahead of CPI

ahead of CPI
| Mar 15 12:30 GMT | 1.9% Consensus | 1.6% Previous |
Daily Charts


The result

Wednesday, 13 March 2013

Tuesday, 12 March 2013
Apple

hourly

Apple hovers around weekly Pivot 428.60
Timelessfx Evening News S&P500 Charts and News
The June S&P 500 posted an inside day with a lower close on Tuesday as it
consolidates some of the rally off November's low. The low-range close sets the

 stage for a steady to lower opening when Wednesday's night session begins
trading. Stochastics and the RSI are overbought but remain neutral to bullish
signaling that sideways to higher prices are possible near-term. If June
extends the rally off November's low, weekly resistance crossing at 1586.50 is
the next upside target. Closes below the 20-day moving average crossing at
1516.44 would confirm that a short-term top has been posted. First resistance
 is Monday's high crossing at 1551.40. Second resistance is weekly resistance
crossing at 1588.50. First support is the 10-day moving average crossing at
1528.99. Second support is the 20-day moving average crossing at 1516.44.
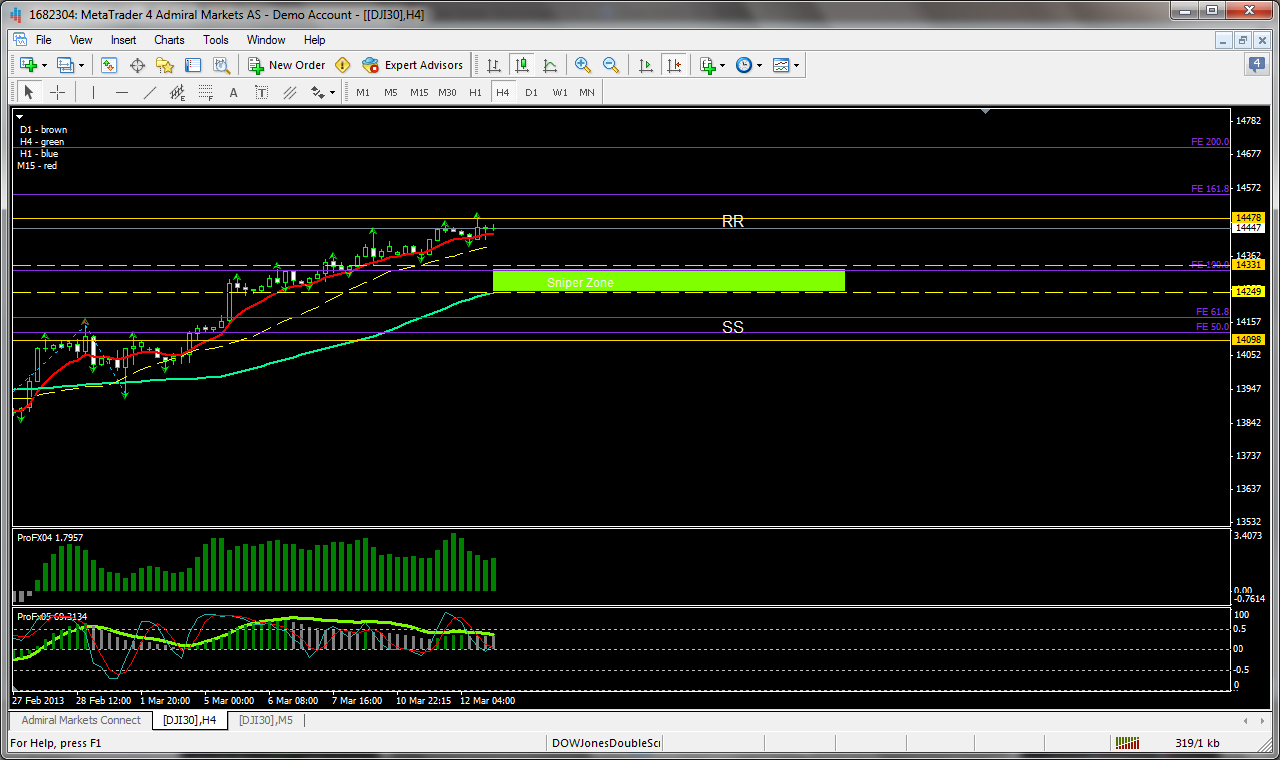
Timelessfx Evening Dow Charts Levels and News
The Dow closed lower due to profit taking on Tuesday as it consolidates some
of this year's rally. The low-range close sets the stage for a steady to lower
 daily Time frame
opening on Wednesday. Stochastics and the RSI are overbought but remain neutral
daily Time frame
opening on Wednesday. Stochastics and the RSI are overbought but remain neutral
to bullish signaling that sideways to higher prices are possible near-term. If
the Dow extends this year's rally into uncharted territory, upside targets will
be hard to project. Closes below the 21-day moving average crossing at 14,098
are needed to confirm that a short-term top has been posted. First resistance
 is today's high crossing at 14,478. Second resistance is hard to project with
the Dow not trading into uncharted territory.
However i have placed some fib extension for possiable targets
First support is the 10-day
moving average crossing at 14,249. Second support is the 20-day moving average
crossing at 14,098.
 4hr time frame
of this year's rally. The low-range close sets the stage for a steady to lower
 daily Time frame
to bullish signaling that sideways to higher prices are possible near-term. If
the Dow extends this year's rally into uncharted territory, upside targets will
be hard to project. Closes below the 21-day moving average crossing at 14,098
are needed to confirm that a short-term top has been posted. First resistance
 is today's high crossing at 14,478. Second resistance is hard to project with
the Dow not trading into uncharted territory.
However i have placed some fib extension for possiable targets
First support is the 10-day
moving average crossing at 14,249. Second support is the 20-day moving average
crossing at 14,098.
 4hr time frame
hrly time frame
The Keys to the vault
Lesson: 2
Many beginning traders are unaware that the markets will confront him/her with an environment that is categorically different from anything he is accustomed to or trained to deal with effectively by society. For example the markets can be looked at as a never ending event always changing, virtually without structure, in perpetual motion with unlimited potential for profits as well as loss in every trade.
The psychological impact on the individual interacting with an environment is formidable- especially when you consider the many ways in which all of us typically go about structuring our lives with highly defined boundaries. Limits, and rules, so things stay basically the same. For most a static environment is fundermental component of their sense of security and well-being.
The markets can tease a trader with the very real possibility of fulfilling his grandest dreams of financial independence and at the same time stand ready and willing to take away everything he owns -and more.
Also I would like to Importantly add that the principles of time, effort and reward associated with most jobs situation simply do not apply with the markets.
Most jobs offer an Unchanging reward, regardless of effort because of hourly wages or yearly salaries.
For a trader effort can be irrelevant, and there is virtually no relationship between time and reward. A trader can be stunned with a windfall of rewards and profit in a matter of seconds for making one simple decision and the only energy expended was mental. Coupled with
Strong trading plan
Monday, 11 March 2013
Developing a winning attitude
Lesson 1 :
The psychology of trading
Developing a winning attitude
Have you heard about a seminar being offered where you can learn how to walk barefoot over a 20 -foot bed of red Coals.
The only difference between those who excel and those of mediocre achievement is that one group has learned a thinking methodology that has not occurred to the other.
The discovery of the South Pacific "fire walkers" amazed scientist ( the ability to walk over Hot coals with their bare feet) they analysed their beliefs and attitudes so as to arrive at a thinking methodology they could teach in the United States
What I am offering is a new way of thinking for you to excel as a trader and It may result In you exploring new things about your self and question some of your beliefs
And probe deeply rooted concepts of what is possible.
Something's only through a mental house cleaning" can help you throw away failure to make room for success. And exposing yourself to information that may cause you to ask yourself " what if it were true" is the first step to any mental cleansing process.
Thursday, 7 March 2013
EURUSD

After initial dip, Euro recovers against dollar on strong bond auction in Spain and as ECB left rates unchanged at 0.75%. Sterling also recovers against dollar after BOE stand pat. But the biggest mover is found is the Japanese yen which suffers another round of sell off in crosses. And, USD/JPY also jumps through recent resistance of 94.55
Wednesday, 6 March 2013
psychology of being A Master trader using binary
Afternoon all💥 In the past we've worked on Purpose,Vision and goals from Sunday we will work on the psychology of being A Master trader: any questions ? Please tell you're friends about this Master class exclusive here on your UK Special Ops group
And also this is a plot class based on your questions and interaction.
And also this is a plot class based on your questions and interaction.
Timelessfx News @ zero o'clock
Morning,
EU will today announce final figures for GDP in the fourth quarter.
Last month the flash estimate showed that GDP fell by 0.6%
Means
Eurozone Q4 GDP: Actual:-0.6% Consensus:-0.6 and Previous: -0.1
Will the final Q4 GDP figure come better or worse than expected.
Economic Fact
Vodafone shares have rallied 6% this morning after reports have emerged that Vodafone is in talks with Verizon over a full merger.
Assets to watch out for
FTSE100 and VODAFONE EUR\USD
Monday, 4 March 2013
The Law of Burning desire
The Law of Burning desire
The motivation to acquire wealth must be accompanied by a burning desire for wealth creation:
a burning desire protects your mind in moments of discouragement. It helps you to face challenges and obstacles which present themselves on a day-by-day basis. Desire links us to the proof and result we desire.
Wilfred Peterson said" Success is focussing the full power of all you are on what you have a burning desire to achieve"
Burning desire with a rage to Master in trading: is what keeps you fired up when everything around you seems to show a negative indication
Therefore your action must be consistent with your desire. Your actions end up reinforcing your desire
In the film with Will smith " The Pursuit of Happiness" Will said how did linkon know to add the Pursuit , because for some they may not reach that happiness
Therefore I say add that burning Desire to the equation the Easily believe that it is done. This is what makes Pursuit Possible. It gives the energy for running until there are results
Desire is a quality you must possess I order to win
Napoleons Hill said " The starting point of all achievement is Desire"
Sunday, 3 March 2013
S&P500 Harmonic Out Look daily weekly and 4hrs
Daily
the bulls have taken the upper hand once again. The index is knocking at the
1520 area, despite the lack of participation of some big names, such as Apple
(AAPL). The coming and going of sequester talks barely ruffled a feather, with
macro economic data trumping concerns of big spending cuts. 1520 remains
resistance, and 1514.94 is support for now, with 1509.39 below as a second layer
of support within a narrow range. As to sectors. only the Industrials are in the
red at time of writing. The Financials, Health Care, and Consumer Staples are
the relative leaders on the upside in lackluster trading.

Bearish Butterfly knocking on the door
4hrs Poseidon 

However:
Should the S&P 500 follow the historical average, the index would climb to about 1,730 by the end of the year, surpassing the all-time high of 1,565.15 reached in October 2007 and topping all 15 forecasts from Wall Street strategists tracked by Bloomberg. The gauge rose 0.2 percent to 1,518.20 today, climbing to about 3 percent below the record, after slipping yesterday when the Senate voted to keep $85 billion of automatic spending cuts in place. “Even though the investing community faces economic and legislative hurdles in the near and long term, equity prices have risen in both January and February signaling, in our view, that many of these worries are unwarranted,” Stovall wrote in the note dated Feb. 25. “Since 1945, bucking the typical groundhog giveback has been a plus.”
The last two years have seen back-to-back gains in the first two months, leading the S&P 500 to a 16 percent advance in 2012 and a 2.1 percent rise in 2011, including dividends. The biggest advance when the index rose in January and February was the 52 percent rally in 1954.
To contact the reporter on this story: Whitney Kisling in New York at wkisling@bloomberg.net

S&P500 Hrly
Still bullsih
Major U.S. stock indexes will make another
attempt at reaching all-time records, but the fitful pace that has dominated
trading is likely to continue. This Friday's unemployment report and the hefty
spending cuts that look like they are about to take effect will be at the
forefront.
The importance of whether equities can
reach and sustain those highs is more than Wall Street's usual fixation on
numbers with psychological significance. Breaking through to uncharted territory
is seen as a test of investors' faith in the rally.
"It's very significant," said Bucky
Hellwig, senior vice president at BB&T Wealth Management in Birmingham,
Alabama.
"The thinking is, 'There's just not enough
there for an extended bull run,'" he said. "If we do break through (record
highs), then maybe the charts and price action are telling us there's something
better ahead."
Flare-ups in the euro zone's sovereign debt crisis and
Friday's report on the U.S. labor market could jostle the market, though U.S.
job indicators have generally been trending in a positive direction.
crisis and
Friday's report on the U.S. labor market could jostle the market, though U.S.
job indicators have generally been trending in a positive direction.
crisis and
Friday's report on the U.S. labor market could jostle the market, though U.S.
job indicators have generally been trending in a positive direction.
Small- and mid-cap stocks hit lifetime
highs in February. Now the Dow Jones industrial average and the S&P 500 are
racing each other to the top. The Dow, made up of 30 stocks, is about 75 points
- less than 1 percent - away from its record close of 14,164.53, which it hit on
Oct. 9, 2007. The broader S&P 500 is still 3 percent away from its record
closing high of 1,565.15, also reached on Oct. 9, 2007.
The advantage may be in the Dow's court.
So far in 2013, it has gained 7.5 percent, beating the S&P 500 by about 1
percent.
THE RALLY AND THE REALITY CHECK
The Dow's relative strength owes much to
its unique make-up and calculation, as well as to investors' recent preference
for buying value stocks likely to generate steady reliable gains, rather than
growth stocks.
But the more defensive stance illustrates
how stock buyers are getting concerned about this year's rally. While investors
don't want to miss out on gains, they are picking up companies that are less
likely to decline as much as high-flying names - if a market correction
comes.
The Russell Value Index is up 7.6 percent
for the year so far, outpacing the Russell Growth Index's 5.7 percent rise.
Within the realm of the S&P 500, the consumer staples sector led the market
in February, gaining 3.1 percent.
There is some concern that growth-oriented
names are being eclipsed by defensive bets, said Ryan Detrick, senior technical
strategist at Schaeffer's Investment Research in Cincinnati.
"This isn't a be-all and end-all sell
signal by any means, but we would feel much more comfortable if some of the more
aggressive areas, like technology and small caps, would start to gain some
leadership here," Detrick said.
Signs that investors are becoming
concerned about the rally's pace is evident in the options market, where the
ratio of put activity to call activity has recently shifted in favor of puts,
which represent expectations for a stock to fall.
"We are seeing some put hedging in the
financials, building up for the past month," said Henry Schwartz, president of
options analytics firm Trade Alert in New York.
The put-to-call ratio representing an
aggregate of about 562 financial stocks is 1:1, when normally, calls should be
outnumbering puts.
Investors have no shortage of reasons to
crave the relative safety of blue chips and defensive stocks. Although markets
have mostly looked past uncertainty over Washington's plans to cut the deficit,
fiscal policy negotiations still pose a risk to equities.
The $85 billion in spending cuts that were
set to begin on Friday is expected to slow economic growth this year if
policymakers do not reach a new deal. Markets so far have held firm despite the
wrangling in Washington, but tangible economic effects could pinch stock prices
going forward.
The International Monetary Fund warned
that full implementation of the cuts would probably take at least 0.5 percentage
point off U.S. growth this year.
EASY MONEY AND TEPID HIRING
Investors will also take in a round of
economic data at a time when concerns are percolating that the market is being
pushed up less by fundamentals and more by loose monetary policy around the
world.
The main economic event will be Friday's
non-farm payrolls report for February. The U.S. economy is expected to have
added 160,000 jobs last month, only a tad higher than in January, in a sign the
labor market is healing at a slow pace. The U.S. unemployment rate is forecast
to hold steady at 7.9 percent.
While lackluster data has been a catalyst
in the past for stock market gains as investors bet it would ensure continued
stimulus from the Federal Reserve, that sentiment may be wearing thin.
Markets stumbled last week following
worries that the Fed might wind down its quantitative easing program sooner than
expected.
"It shows the underpinning of the market
is being driven at this point by monetary policy," Hellwig said.
With investors questioning what is behind
the rally, it will make a run to record highs even more significant, Hellwig
added.
"There's smart people that are in the bull
camp and the bear camp and the muddle-through camp," Hellwig said. "The fact
that you can statistically, using historical evidence, make a case for going
higher, lower, or staying the same makes this number very important this time
around."
(Wall St Week Ahead runs every Sunday.
Comments or questions on this column can be emailed to:
leah.schnurr(at)thomsonreuters.com)
Gold Harmonic Outlook with Fundermentals
Fundermentals on gold
On passed week there were some events that significant in general, but had only slight impact on gold market. Let’s start from US Data on consumer spending and confidence, factory activity that has pointed on pickup in economy growth. Although Bernanke was hurry to calm down markets by statement that Fed doesn’t see yet reasons for closing QE program and turn to more  hawkish policy – this had no expectable impact. We’ve discussed that previous FOMC voting has carried real surprise when votes on QE outlook are divided. Investors still believe that better U.S. outlook could prompt the Fed Reserve to halt its stimulus earlier than expected. Whatever Big Ben says – votes are split and this fact remains. It just means that situation is changing per se and when Fed will announce closing of QE officially – this is just a question of time.
Second issue is about US Budget spending cuts across the board. U.S. lawmakers have so far failed to agree on a comprehensive budget plan to reduce the government deficit. Since this initiative is not new and the failure to find a compromise on the way how will be better to accomplish it, this had moderate impact on gold prices. What is a real interesting is that new debates on US Debt ceil should come on May and the fact that the Republicans and Democrats have been unable to agree on that boast poorly for their ability to come on agreement over the debt ceiling. Thus Analysts now closely monitor how a divided Congress will deal with the next debt ceiling, which is scheduled to come into effect on May 18. Interestingly that gold rallied to an all-time high in September 2011 a month after the United States lost its “AAA” rating that year.
hawkish policy – this had no expectable impact. We’ve discussed that previous FOMC voting has carried real surprise when votes on QE outlook are divided. Investors still believe that better U.S. outlook could prompt the Fed Reserve to halt its stimulus earlier than expected. Whatever Big Ben says – votes are split and this fact remains. It just means that situation is changing per se and when Fed will announce closing of QE officially – this is just a question of time. Second issue is about US Budget spending cuts across the board. U.S. lawmakers have so far failed to agree on a comprehensive budget plan to reduce the government deficit. Since this initiative is not new and the failure to find a compromise on the way how will be better to accomplish it, this had moderate impact on gold prices. What is a real interesting is that new debates on US Debt ceil should come on May and the fact that the Republicans and Democrats have been unable to agree on that boast poorly for their ability to come on agreement over the debt ceiling. Thus Analysts now closely monitor how a divided Congress will deal with the next debt ceiling, which is scheduled to come into effect on May 18. Interestingly that gold rallied to an all-time high in September 2011 a month after the United States lost its “AAA” rating that year.
aily 
ABCD 100% expansion
4hrs
So the major driven force for gold market will remain US economy data and changing Fed rhetoric. Most investors are careful with radical assessment of current situation on Gold. There are different opinions now from those who think that gold could show deep retracement to 1200-1300 level (we’ve discussed this either on previous week) to those who think that retracement can finish as fast as it has started and may be Gold is forming Double Bottom on daily  time frame . Since there is no agreement on spending sequestering – if debt will continue to rise this will support gold prices in long term perspective.
1hrly

Still all ETF across the board confirm by holding statistics that this is one among greatest outflows on Gold market. Hedge funds have made significant withdrawals and ETF sold out their holdings. Thus SPDR ETF has contracted holdings more than for 70 tones in 2 weeks.
As we will see from charts below – speculators partially have re-established longs but this has happened at decreasing of Open Interest. This is more common with retracement action rather than trend. So this situation indirectly hints on potential downward continuation.
Latest COT Report shows this recovery – speculators’ position slightly increases but this happens amid decreasing of Open Interest.
2nd 1hrly view
view
 view
viewEURUSD With Elliot wave count
Daily 
EURUSD: fell for the fourth consecutive week, dipping its toes under the 1.30 line following the indecisive Italian elections and the weak economic data. Will the slide continue? The rate decision and the preceding press conference are the highlights of a very busy week. Here is an outlook for the events moving the euro and an updated technical analysis for EUR/USD, now in lower ground.
The Italian elections resulted in a deadlocked Senate. This sent the euro plunging. Political parties are trying to find a compromise, but there seems little room for cooperation. Italy might go to the polls again soon. The euro-zone’s third largest economy already has serious issues: unemployment is rising fast and PMIs point to a deepening recession. The euro-zone as a whole is seeing higher unemployment and now also lower inflation – below the ECB’s target. Will Draghi cut the rates or hint about an upcoming rate cut? Let’s start:
4hrs 

- Spanish employment data: Monday, 8:00. Spanish unemployment rose to 4.98 million in January, with a 132,055 new unemployed in January alone, following a reduction of 59,100 unemployed in December. This high figure indicates the eurozone’s fourth-largest economy is struggling with the highest unemployment rate since the death of General Francisco Franco in 1975. A rise of 77,500 unemployed is expected this time.
- Sentix Investor Confidence: Monday, 9:30. Euro-zone Sentix investor sentiment improved to -3.9 in February following -7 in January, amid the ECB forecast of the Eurozone growth in the second part of 2013. Sentiment is expected to worsen to -4.5.
- PPI : Monday,10:00. Euro-zone producer prices continue to drop in December down 0.2% in December following the same decline in the previous month. The reading was in line with market expectations. The Annual inflation in January dropped to 2.0% complying with the ECB’s target for 2013. A gain of 0.5% is expected now.
- Services PMIs: Tuesday. Eurozone services PMI improved to a ten month high in January with a reading of 48.6 from 47.8 in December, despite an ongoing contraction in this sector. This reading was higher than the 44.7 predicted by analysts. Meanwhile, the Italian and Spanish service economies all remained in contraction in January, although Spain registered a nice climb to 47 from 44.3 in December. Italy disappointed with a lower than expected reading of 43.9 following 45.6 in December. Only Germany is showing signs of recovery. Spanish Services PMI is expected to climb to 47.8, Italy Services PMI is forecast a further decline to 43.6 and the Eurozone is expected to decline to 47.3. Manufacturing PMIs were quite disappointing.
- Retail Sales: Tuesday, 10:00. Retail sales in the 17 countries euro countries, dropped sharply in December by 0.8%, following 0.1% decline in November. Nevertheless the worst is over for the Eurozone according to analysts’ forecast with an ongoing steady improvement. An increase of 0.3% is forecast now.
- Revised GDP: Wednesday, 10:00. The initial GDP report showed a significant contraction of 0.6%, led by a contraction of the same rate in Germany. While the German contraction is seen as a one-time event, many other countries are in a long recession, and will probably see it going on for a few more months. The 0.6% drop will likely be confirmed now.
- German Factory Orders: Thursday, 11:00. German factory orders rebounded in December, rising 0.8% following a 1.8% plunge in the previous month. The climb occurred amid rising demand. Furthermore German business climate has also improved, signaling an end to weakness in the industrial sector. An increase of 0.6% is predicted now.
- Eurozone rate decision: Thursday, 12:45, press conference at 13:30. The ECB isn’t likely to move on the rates in the March meeting. Draghi’s warning on the exchange rate of the euro already had a significant effect, and the elections in his home country already did more than a rate cut could have done to weaken the euro. The focus is expected to remain on the press conference. Draghi is likely to try and balance between the current economic situation which is quite depressing, and the optimism for growth in H2 2013, coming now from higher business confidence, mostly in Germany. An ongoing political turmoil in Italy could bring the OMT back into the limelight. The drop in inflation to 1.8% and the rise in unemployment to 11.9% could lead Draghi to hint about a rate cut in April. This could come in a form of saying that the decision was not unanimous, and that some members wanted a cut.
- German Industrial Production: Friday, 11:00. German Industrial Production increased 0.3% in December, rising for the first time in five months. The reading beat predictions for a 0.2% increase and followed a 0.2% contraction in November. Manufacturing output edged up 1.2% in December, while energy production dropped 3.4% over the month. A rise of 0.6% is forecasted.
1hrly 
EUR/USD Technical Analysis
Euro/dollar started the week very positively, rising above 1.33 before the real results came out of Italy. It then took a plunge, and traded between the important 1.30 and 1.3170 lines (discussed last week). After being capped at 1.31, the pair fell below 1.30 and challenged the 1.2960 line before closing above 1.30, at 1.3026.
Technical lines from top to bottom:
We start from lower ground once again. 1.3690 worked as support during the fall of 2011 and is a minor line. 1.3588 worked as a clear separator of ranges during January 2013 and proved to work as resistance in February.
1.3486 was the peak seen in February 2012 and is a separator of ranges. An attempt to break higher eventually failed. 1.34 was a stubborn cap during the spring of 2012 and continued its stubborn stance in January 2013 – the line now turns into resistance. These are the head and shoulders lines.
1.3350 was a peak in January 2013 and worked very nicely as support during February. The line is weaker now. Below, 1.3290 served as resistance before the pair collapsed in May, After many failures to break higher, the euro finally pushed through.
1.3255 provided support during January 2013 and also beforehand. A recovery attempt failed to reconquer this line. This is the bottom of the previous range. 1.3170, which was the peak of September, served as support for the pair after the break in December and worked as strong resistance after the Italian elections. This is a key line, now on the upside.
1.3130 proved to be strong resistance during December 2012 and now switches positions to support. 1.3100 is a minor line after working as temporary resistance in December 2012.
1.3030 provided some support at the same period of time, and also at the end of November 2012. Both are minor in comparison with the next line. The very round 1.30 line was a tough line of resistance for the September rally. In addition to being a round number, it also served as strong support. The move below this line in early March was eventually rejected. Will it break decisively this time?
It is closely followed by 1.2960 which provided some support at the beginning of the year and also in September and October – the line is strengthening once again after temporarily cushioning the fall during December.
Lower, 1.2880 worked in both directions during 2012 and was the beginning of the uptrend support line. Lower, 1.2805 was the bottom border of the wide 1.2805-1.3170 that characterized the pair’s trading for a long time.
Below, 1.2746 worked as a separator of ranges during November, and is a minor line on the downside. This is followed by the round number of 1.27, which is minor as well. The really important line is the November trough of 1.2660.
Uptrend support breakdown proved critical: After sliding within the channel (thick black lines), EUR/USD made a clear breakdown and this let the pair fall. The channel accompanied the pair since December 2012 and was briefly broken to the upside.
write up by forex crunch
GBPUSD Outlook With Elliot wave count
GBPUSD

- Construction PMI: Monday, 9:30. Construction PMI has been stuck below the 50 level since November 2012, indicating sustained contraction in the UK construction sector. As well, the index has failed to meet the estimate since that the November reading. The estimate for the March release is slightly higher, at 49.2 points.
- BRC Retail Sales Monitor: Tuesday, 00:01. This indicator, which is based on data from stores belonging to the BRC, helps provides a snapshot of the retail sales industry. The indicator jumped 1.9% in February, its best reading in over a year. The markets will be hoping for another strong showing in the upcoming release.
- Halifax HPI: Tuesday, 5th-7th. This indicator measures the change in house prices in the UK, and as such is a leading housing indicator. The index declined 0.2% in February, and the markets are expecting a turnaround in the March release, with an estimate of a 04% gain.
GBPUSD 4hrs

4:Services PMI: Tuesday, 9:30. Services PMI has been above the 50-point level for over a year, with the exception of the January 2013 release. This indicates that the UK service industry has been steady, with modest expansion. The previous reading came in at 51.5 points, and the March estimate stands at the same figure.
5:BRC Shop Price Index: Wednesday, 00:01. This index measures the change in price of goods from stores belonging to the BRC, and provides analysts with useful data concerning consumer inflation in the UK. Prior to the February reading, the index posted gains of 1.5% for three consecutive months. The index showed a much smaller gain in February of 0.6%.
6:BOE Governor Mervyn King Speaks: Wednesday, 9:45. Governor King will be testifying before a parliamentary committee about banking standards. A speech which is considered more hawkish than expected is bullish for the pound.
7:Asset Purchase Facility: Thursday, 12:00. The BOE has been purchasing assets at the rate of 375 billion pounds a month since June 2012. No change is expected in the March announcement.
8:Official Bank Rate: Thursday, 12:00. The BOE’s key interest rate has been set at 0.50% since 2009, and the markets are not expecting any change in the March announcement. The MPC will release a Rate Statement at the same time as the interest rate announcement.
9:Consumer Inflation Expectations: Friday, Tentative. This indicator surveys consumers for their expectation of inflation over the next 12 months. This indicator, which is released quarterly, is useful for tracking actual inflation in the UK.
GBPUSD1hrly 

Friday, 1 March 2013
Money is a neutral instrument.
Money is neutral a instrument. Therefore the purpose for it must be established before the purpose for it must be established before the wealth is created or else it can ruin the owner
Definiteness of purpose is cardinal point for all wealth creation. If you do not have strong reason for wealth creation, you do not have therefore enough fire to make you make it happen. For th Special Ops squad : Once there is a Target, the possibilities become endless
Definiteness of purpose is cardinal point for all wealth creation. If you do not have strong reason for wealth creation, you do not have therefore enough fire to make you make it happen. For th Special Ops squad : Once there is a Target, the possibilities become endless
Subscribe to:
Comments (Atom)